SAP Solution Manager (SolMan) includes a complete dashboard framework for visualizing data metrics and KPIs across a wide variety of areas. This includes areas such as availability, performance, service delivery, and crucially, system security. What’s more, the process for enabling and customizing dashboards is relatively quick and simple. This short guide walks through the steps to leverage the SAP-delivered dashboard apps in SolMan for security monitoring.
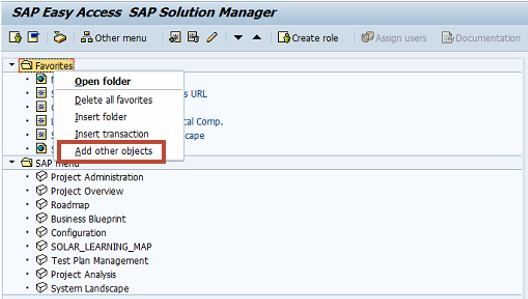
The first step is creating a link to the dashboard in the SAP Easy Access menu. Once you have logged into SolMan, right click on the Favorites folder and select Add Other Objects.
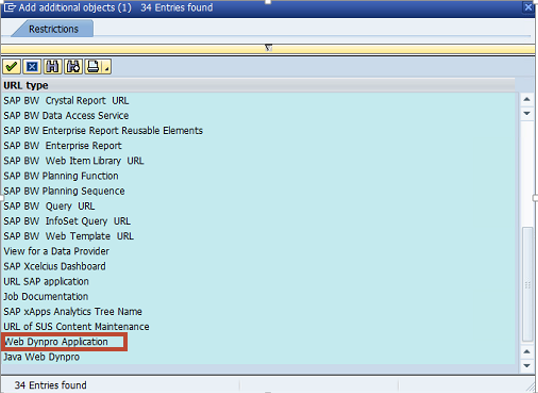
From the list in the Restrictions screen, choose Web-Dynpro Application.
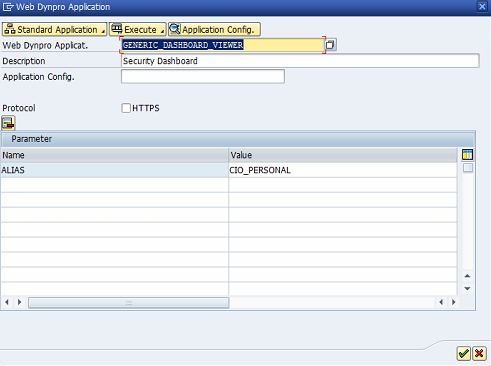
Enter GENERIC_DASHBOARD_VIEWER in the Web Dynpro Applicat. field of the Web Dynpro Application screen.
Enter Security Dashboard in the description field.
Select HTTPS if applicable.
Within the Parameter table, enter ALIAS in the Name column and CIO_PERSONAL in the Value column. Click Save when complete.
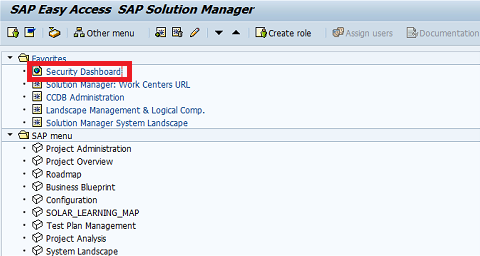
The Security Dashboard link will now appear in your Favorites menu. Double click on the link to launch the dashboard in a browser. You will require the role SAP_SM_DASHBOARDS_DISP to access the dashboard, including the auth object SM_DBSINST.
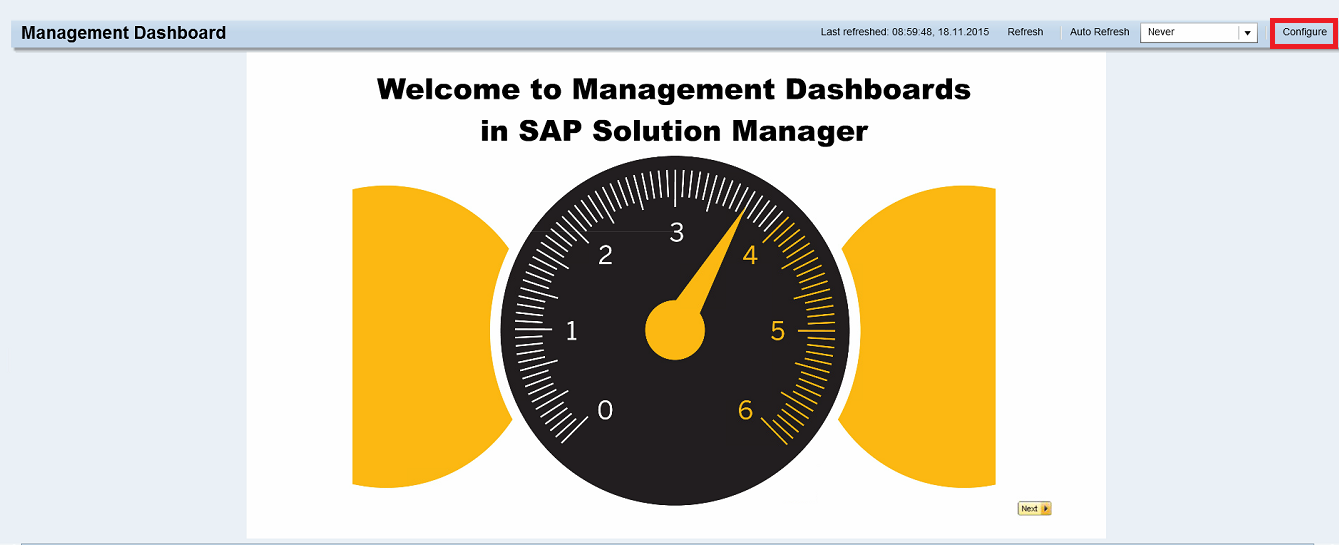
The second step is configuring security apps in the dashboard. The welcome screen below is displayed the first time you access the dashboard. Select Configure in the top right of the screen and then Add new App.
Select the Cross-Application category. Click on the image below to enlarge.

Select and configure the following apps in sequence: Security Overview, Security Details, and Security List. You can learn more about these dashboard security apps at the SAP Help Portal.
Follow the steps below for each app.
Select one of the specified apps and click OK.

Enter a title for the app in the Header field. In the example below, we have configured the Security List app which displays the compliance status of systems by Software, Configuration, and User areas. The Software group includes checks for the release and support pack level of critical software components, kernel levels, and unapplied Security Notes. The Configuration group includes checks for security-relevant profile parameters, access control filters in operating system files such as sec_info and reg_info, client change settings, Security Audit Log filters, RFC destinations with stored logon credentials, trusted RFC connections, and active Web services. Finally, the Authorization group includes checks for users with critical authorization objects or combinations of auth objects, sensitive transactions, and powerful SAP-delivered profiles such as SAP_ALL. It also includes checks for standard users with default passwords.
The next step is to select the target system. This is the template that contains the baseline security policy used to check the compliance levels of systems in your landscape. You can select default templates such as 0SEC_NEW. However, best practice is to develop custom templates to perform checks for a wider array of vulnerabilities in SAP systems than covered by SAP-delivered defaults. Templates developed by Layer Seven Security, for example, perform over 500 vulnerability checks for ABAP, Java and HANA systems.
Once you have selected the target system, specify the comparison systems that should be monitored using the dashboard security app. In the example below, we’ve chosen to monitor the ABAP stack of the system SMP using the custom template in the virtual target system SEC_ABAP. This is a simplified example. In most cases, multiple systems should be selected for monitoring at the same time against a single target system.

Select Preview to sample the dashboard and then click Apply when done. Perform the configuration steps for the other security apps available in the SolMan dashboard. Save the Dashboard. Once complete, the dashboard should resemble the following:

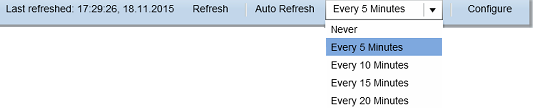
The final step is to set the Auto Refresh frequency in the drop-down menu positioned in the top right of the dashboard. Once set, the dashboard will refresh as often as every 5 minutes for near real-time security monitoring.