Security KPI Monitoring with SolMan Dashboards
SAP Fiori revolutionizes the user experience in Solution Manager 7.2. The dynamic tile-based layout replaces the work center approach in Solution Manager 7.1. In fact, since the Fiori launchpad provides direct and customizable access to applications, it virtually removes the role of work centers in Solution Manager. Fiori and Fiori Apps are the first pillar of the new user experience in Solution Manager. The second is the revised dashboard framework.
Both Fiori and the dashboard framework are built on HTML5-compliant SAPUI5 technology. Unlike the Flash-based dashboards in Solution Manager 7.1, dashboards in version 7.2 are compatible with most browsers and mobile devices. In common with the packaged dashboards available using the Focused Insights add-on, the dashboard framework includes a series of reusable dashboard templates to support application and cross-application scenarios. This includes areas such as availability and performance management, incident management and service management.
However, in contrast to Focused Insights and dashboards in Solution Manager 7.1, the new framework provides a flexible and user-friendly platform for creating custom dashboards to monitor key performance indicators (KPIs) in SAP systems and landscapes, including security-relevant KPIs.
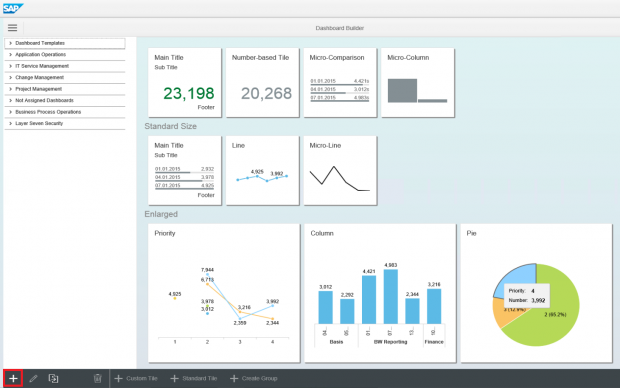
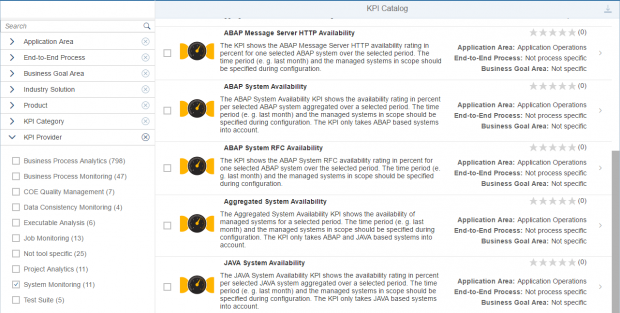
A dashboard consists of multiple tiles. Each tile is associated with a single KPI. Tiles can be clustered into groups within a dashboard. Once the option to a create new dashboard is selected (see below), users can select either standard tiles or create custom tiles for the dashboard. Standard tiles include predefined KPIs available from the SAP KPI Catalog.
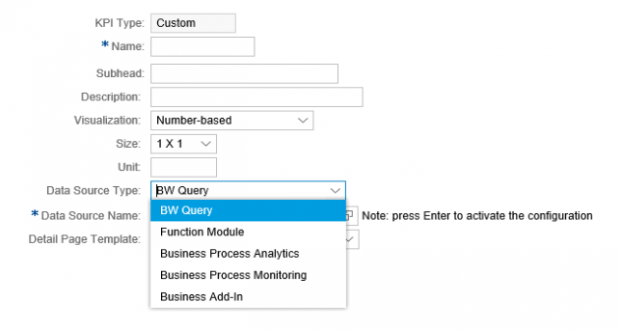
For custom tiles, users can select from a variety of data sources including Business Warehouse. Security-related information such as vulnerabilities and missing security notes detected by Solution Manager are stored in InfoProviders within an internal Business Warehouse.
Once the data source is selected, users can maintain filters and thresholds to break down the results.
Users can also select the type of visualization for each tile including combination, micro, single, stack and table charts.
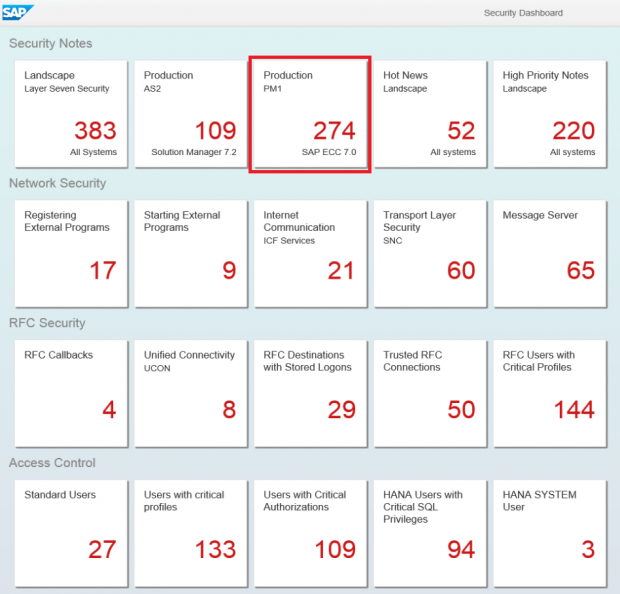
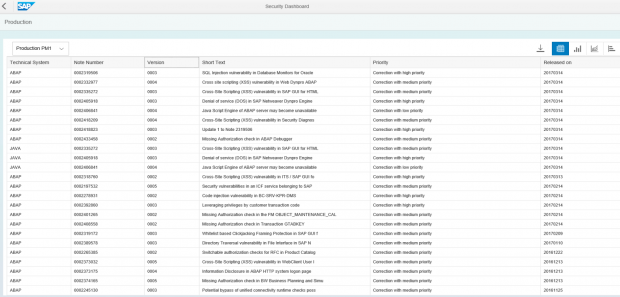
Dashboards support drill-down analysis by enabling users to navigate directly from summarized information in each tile to the detailed information in Business Warehouse. An example is provided below. The following dashboard monitors security KPIs for patch levels, network security, RFC security, access control, logging and auditing, and system configuration management. The highlighted tile in the dashboard displays the number of unapplied security notes for system PM1. A single click on the tile will display the details of the notes in a table that can then be exported directly to Excel.


