Layer Seven Security

Discover, Implement and Test Security Notes using SAP Solution Manager 7.2

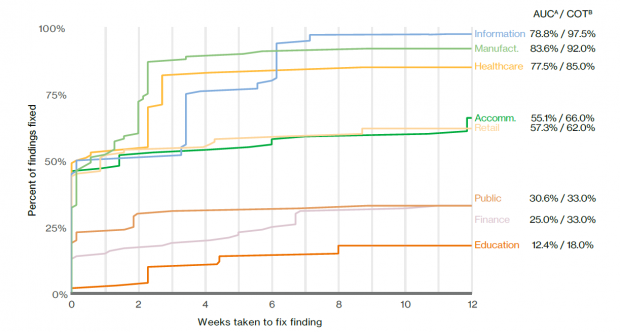
The results of the recent Verizon DBIR revealed significant differences between industries in terms of vulnerability patching. Organizations in sectors such as information technology and manufacturing typically remove over 75% of vulnerabilities within 3 weeks of detection. At the other end of the spectrum, 75% or more of vulnerabilities discovered in financial and public sector organizations and educational institutions remain unpatched for longer than 12 weeks after discovery.

The DBIR masks important differences between patching for devices and applications. Servers, for example, are generally more effectively patched than routers and switches.

Patch cycles for SAP infrastructure and applications are typically more drawn-out than most other technologies.  There are several reasons for this. The most important is the lack of visibility into the impact of SAP patches. This leads to a reluctance to apply corrections that may disrupt the performance or availability of systems.

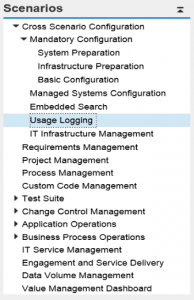
SAP Solution Manager 7.2 overcomes this challenge by enabling customers to pinpoint the impact of security notes before they are applied in systems. Change impact analysis is performed using Usage and Procedure Logging (UPL) and Business Process Change Analyzer (BPCA) integrated with System Recommendations (SysRec).

SysRec provides a real-time analysis of missing security notes and support packs for ABAP and non-ABAP systems including Java and HANA. It connects directly to SAP Support to discover relevant notes and packs for systems configured in the LMDB – SolMan’s landscape information repository. It also connects to each managed system within SAP landscapes to check the implementation status of notes.

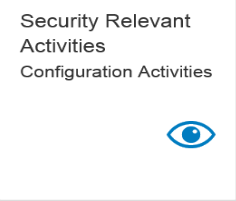
System Recommendations is accessed through the Change Management group in the Fiori launchpad for SAP Solution Manager.

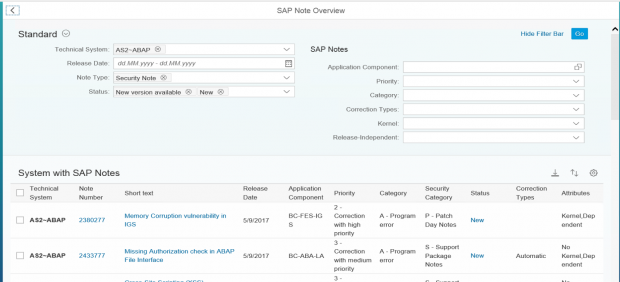
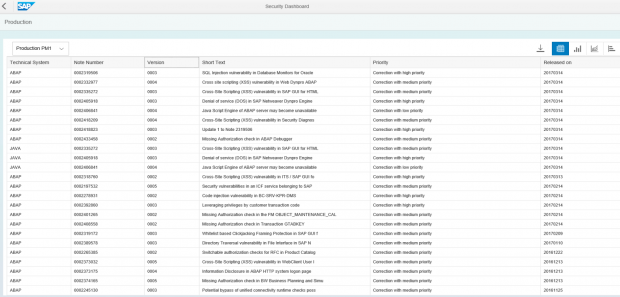
The dashboard below is displayed after the SysRec tile is selected and summarizes notes across the landscape. IT Admin Role and System Priority are attributes maintained in the LMDB. Views can be personalized to sort or filter by attributes or notes.

You can apply a wider selection of filters in the detailed section of SysRec to further breakdown the results.

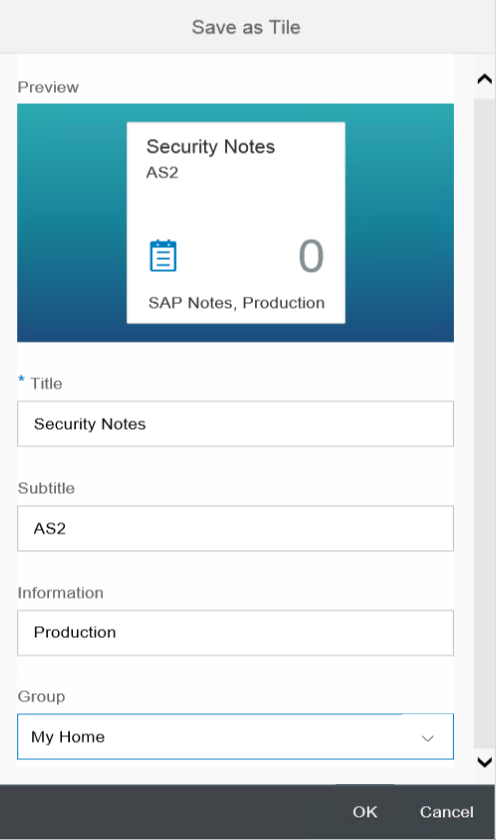
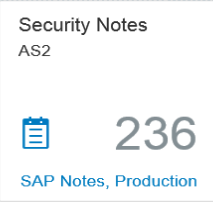
Once the filters are applied, the selection can be saved as a Fiori to tile to avoid reapplying the filters during future sessions. The tile is saved to the launchpad and the counter in the tile automatically updates based on the current status of the system.

The details for each note can be read by clicking on the short text.

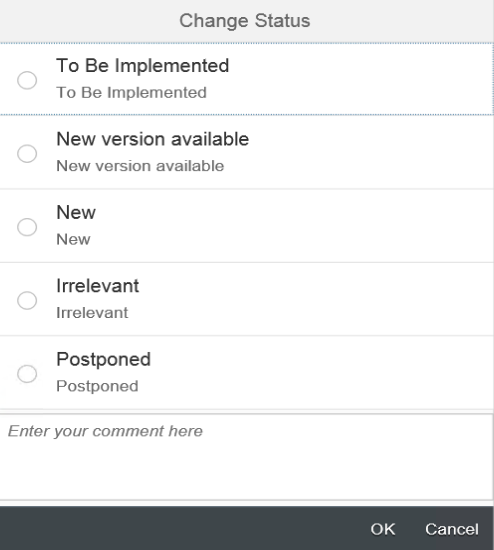
The Actions option allows users to change the status of notes and add comments. Status options are customizable.

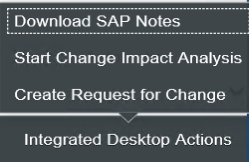
Corrections can be downloaded directly from SAP Support by selecting Integrated Desktop Actions – Download SAP Notes.

Once selected, you can change the target system before the download. The note will be available in SNOTE within the target system after the download.
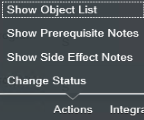
Change impact analysis is performed at both a technical and business level. For technical analysis, SysRec reads data collected by Usage and Procedure Logging (UPL) to display information related to the usage level of objects such as programs, methods and function modules impacted by notes. This is performed by selecting the relevant notes and then Actions – Show Object List.

The results below reveal that Note 2373175 is impacting the standard SAP class CL_HTTP_SERVER_NET. This class was used 325311 times in system AS2 during the timeframe defined for UPL.

For business impact analysis, SysRec integrates with Business Process Change Analyzer (BPCA). BPCA reads solution documentation maintained in Solution Manager to discover modules, transactions, reports, and other areas impacted by notes.

SysRec’s ability to perform comprehensive and reliable change impact analysis for security notes enables customers to overcome one of the most significant roadblocks to effectively patching SAP systems. The usage data collected through UPL together with the solution documentation leveraged using BPCA provides SAP customers with the insights to develop test strategies targeted at the actual areas impacted by notes and narrow the window of vulnerability for unpatched systems.

In a forthcoming article, we will discuss how to import SAP templates and create and execute test plans using Test Management in SAP Solution Manager 7.2.

Highlights of the 2017 DBIR Report

The Data Breach Investigations Report (DBIR) has chronicled the growth in security and data breaches for over a decade.  The findings of the most recent report released on April 27 are based on the analysis of more than 42,000 security incidents across a variety of industries and countries.

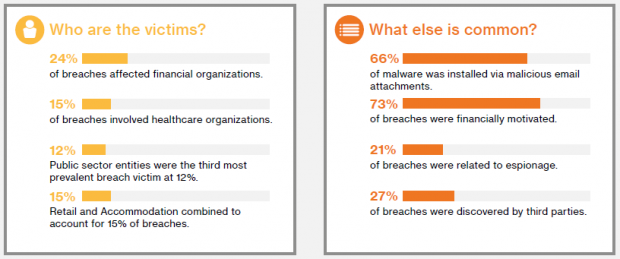
For the first time, the DBIR examines security breaches for key industries to analyze threats confronted by specific verticals. According to the report, attack patterns and motives, as well as susceptibility to different forms of attack vary considerably between industries. For example, manufacturing companies are more likely to fall victim to phishing attacks than public sector organizations. Manufacturers are also more likely to be targeted by attackers motivated by corporate espionage than financial fraud. The industry insights are useful for aligning defense strategies to the risk profiles of each vertical.

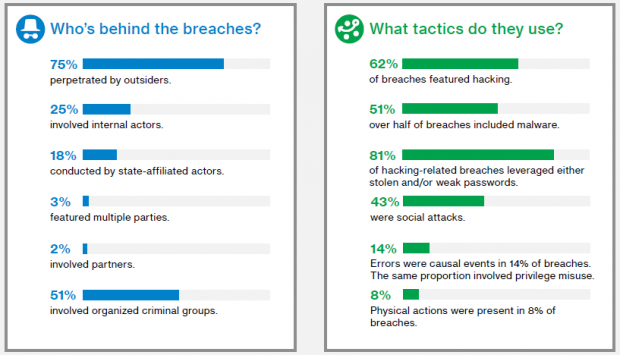
Overall, the DBIR revealed that the majority of breaches (75%) are perpetrated by outsiders. Over half of attacks are performed by organized criminal groups and 18% by state-sponsored attackers. Internal resources are detecting a greater proportion of breaches than prior years, pointing to improving detection and response capabilities within organizations.

Hacking and malware remain the leading causes of security breaches. The report revealed a 50% increase in ransomware attacks. Ransomware is now the fifth most common form of malware, up from 22nd in 2014. There was also a noticeable increase in phishing attacks. Phishing is used in 21% of security incidents and has a success rate of 7.3%.

The DBIR analyzed patching processes across industries and concluded that most sectors follow a quarterly patch cycle. However, the percentage of patches implemented on-time varies from a high of 97.5% in the Information sector to a low of 18% in Education.

The findings of the DBIR are summarized below. The full report is available at Verizon Enterprise.


Get Hands-On with SAP Solution Manager 7.2 at SAPPHIRE NOW + ASUG 2017

Attending next month’s SAPPHIRE NOW and ASUG Annual Conference?

Drop by booth #1280A for a live demonstration of security monitoring using SAP Solution Manager.

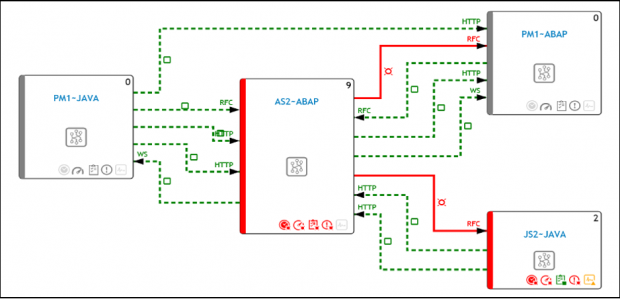
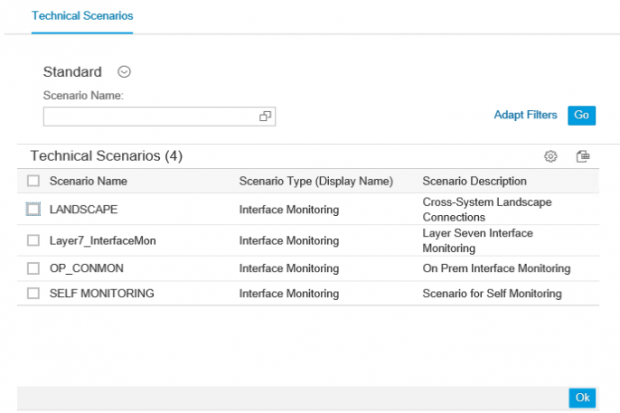
Learn how to schedule Service Level Reports to automatically detect vulnerabilities in your SAP systems, enable Dashboards to monitor security KPIs, detect and apply security notes using System Recommendations, monitor system interfaces with Interface Monitoring, and leverage Security Alerts for real-time threat detection.

If you’ve yet to register, follow the link below to reserve your spot. We hope to see you there!

Security KPI Monitoring with SolMan Dashboards

SAP Fiori revolutionizes the user experience in Solution Manager 7.2. The dynamic tile-based layout replaces the work center approach in Solution Manager 7.1. In fact, since the Fiori launchpad provides direct and customizable access to applications, it virtually removes the role of work centers in Solution Manager.  Fiori and Fiori Apps are the first pillar of the new user experience in Solution Manager. The second is the revised dashboard framework.

Both Fiori and the dashboard framework are built on HTML5-compliant SAPUI5 technology. Unlike the Flash-based dashboards in Solution Manager 7.1, dashboards in version 7.2 are compatible with most browsers and mobile devices.  In common with the packaged dashboards available using the Focused Insights add-on, the dashboard framework includes a series of reusable dashboard templates to support application and cross-application scenarios. This includes areas such as availability and performance management, incident management and service management.

However, in contrast to Focused Insights and dashboards in Solution Manager 7.1, the new framework provides a flexible and user-friendly platform for creating custom dashboards to monitor key performance indicators (KPIs) in SAP systems and landscapes, including security-relevant KPIs.

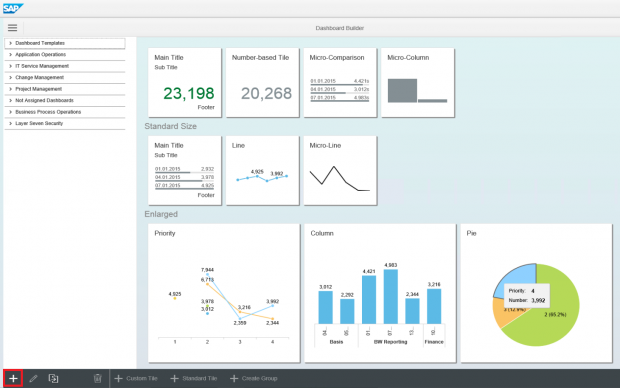
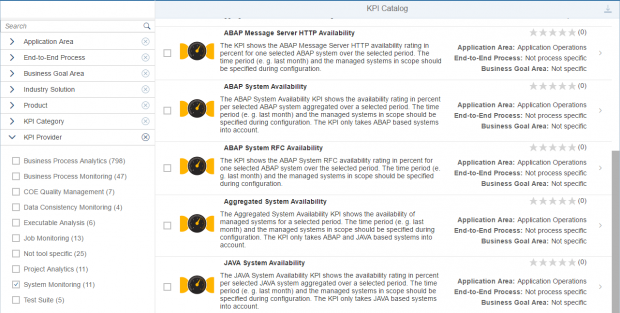
A dashboard consists of multiple tiles. Each tile is associated with a single KPI. Tiles can be clustered into groups within a dashboard. Once the option to a create new dashboard is selected (see below), users can select either standard tiles or create custom tiles for the dashboard. Standard tiles include predefined KPIs available from the SAP KPI Catalog.

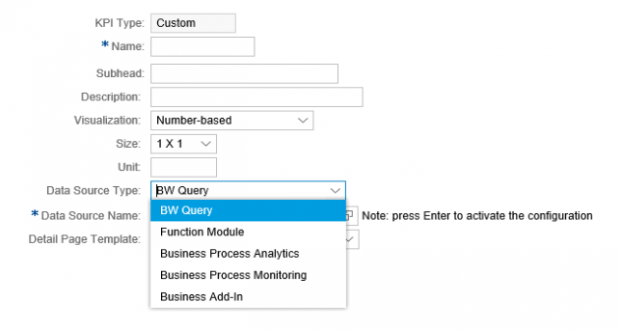
For custom tiles, users can select from a variety of data sources including Business Warehouse. Security-related information such as vulnerabilities and missing security notes detected by Solution Manager are stored in InfoProviders within an internal Business Warehouse.

Once the data source is selected, users can maintain filters and thresholds to break down the results.

Users can also select the type of visualization for each tile including combination, micro, single, stack and table charts.

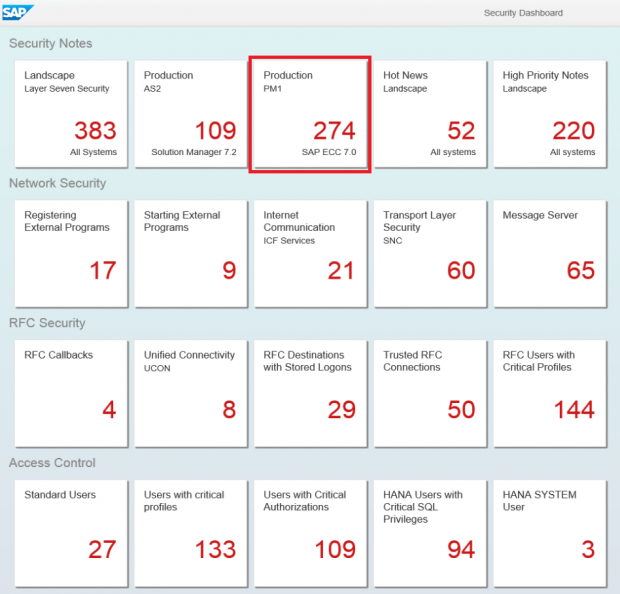
Dashboards support drill-down analysis by enabling users to navigate directly from summarized information in each tile to the detailed information in Business Warehouse. An example is provided below. The following dashboard monitors security KPIs for patch levels, network security, RFC security, access control, logging and auditing, and system configuration management. The highlighted tile in the dashboard displays the number of unapplied security notes for system PM1. A single click on the tile will display the details of the notes in a table that can then be exported directly to Excel.

Explore Service Level Reporting in SolMan 7.2

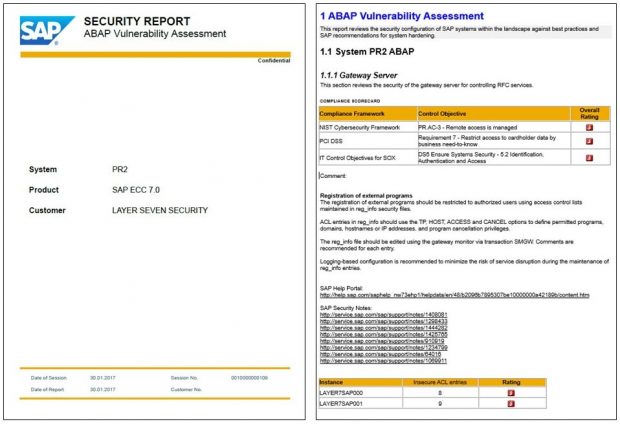
Service Level Reporting (SLR) in SAP Solution Manager performs regular checks against key performance indicators using information available from the EarlyWatch Alert (EWA), Business Warehouse (BW) and the Computer Center Management System (CCMS). The checks can be for single systems or systems grouped into solutions. Reports run automatically on a weekly or monthly schedule but can also be triggered manually for on-demand reporting. SLRs can be displayed in HTML or Microsoft Word. SAP Solution Manger automatically distributes SLRs by email to recipients maintained in distribution lists.

Security-related metrics stored in internal or external BW systems can be read by SLR to create dynamic, detailed and user friendly vulnerability reports. This includes areas such as settings for profile parameters, access control lists in gateway security files, trusted RFC connections or destinations with stored logon credentials, unlocked standard users and standard users with default passwords, active ICF services, filter settings in the security audit log, missing security notes, and users with critical authorizations, profiles or transactions. For HANA systems, it includes database parameters, audit policies, the SYSTEM user, and users with critical SQL privileges. For Java systems, it includes properties for the UME and the invoker servlet. Furthermore, since event data from monitored systems is stored in BW and CCMS, SLR can also report on metrics for events in audit logs including the security audit log and syslog. The latter is particularly relevant for HANA systems which can write logs to operating system files.

SLRs are created and customized in the area for SAP Engagement and Service Delivery in the Fiori Launchpad.

Variants need to be maintained for each report including relevant systems, solutions, data sources, metrics, thresholds and schedule (weekly or monthly).

Once activated, the reports are executed by a regular automated job and accessed through the tile for Service Level Reports.

Comments can be included in SLRs before the reports are automatically distributed by email. SLRs include details of each vulnerability check, risk ratings, and links to relevant SAP Notes and documentation at the SAP Help Portal. Reports also include a gap assessment against compliance frameworks such NIST, PCI-DSS and IT-SOX. SLRs are archived by Solution Manager for trend analysis.

Introducing the SAP Cybersecurity Framework 4.0

Cyber attacks are at epidemic levels. According to research performed by 360 Security, there were over 85 billion attacks in 2015, equivalent to 2000 attacks per second. The cost of data breaches continues to grow, year after year, and reached record levels in 2016. Juniper Research estimate that average costs will exceed $150M within three years.

Introduced in 2014, the SAP Cybersecurity Framework provides the most comprehensive benchmark for securing SAP systems against advanced persistent threats. It presents a roadmap for hardening, patching and monitoring SAP solutions using standard SAP-delivered tools.  The newly released fourth edition of the Framework includes important updates in the areas of transport layer security, network segmentation in virtualized environments, and security settings applied through application level gateways.

The Framework no longer recommends the use of the EarlyWatch Alert (EWA) for security monitoring. This is due to concerns related to the updated rating scale used to grade security risks in the EWA. However, the Framework includes an expanded section for security monitoring using SAP Solution Manager including an overview of security-related tools bundled within Solution Manager such as Configuration Validation, System Recommendations, Monitoring and Alerting Infrastructure (MAI), Service Level Reports, Interface Monitoring, and Dashboards.

The SAP Cybersecurity Framework is available in the white paper Protecting SAP Systems from Cyber Attack.

RFC Hacking: How to Hack an SAP System in 3 Minutes

RFC exploits are hardly new. In fact, some of the well-known exploits demonstrated below are addressed by SAP Notes dating back several years. However, the disturbing fact is that the measures required to harden SAP systems against such exploits are not universally applied. As a result, many installations continue to be vulnerable to relatively simple exploits that could lead to devastating consequences in SAP systems. The impact of the exploits in the demonstration below include the theft of usernames and password hashes, remote logons from trusted systems, and the creation of dialog users with SAP_ALL privileges.

The first exploit demonstrates how attackers can perform operating system commands to extract sensitive information from an SAP database. This is performed through external programs such as sapxpg that are called through the RFC gateway without any authentication. The information extracted in the demo includes user credentials. However, the exploit can be used to read or modify any data from SAP databases.

The second exploit demonstrates how attackers abuse the RFC protocol to change system users to dialog users and then logon from remote systems using the privileges of RFC users.

The final exploit demonstrates the dangers of RFC callback attacks. In the example below, an RFC callback from a compromised system to a vulnerable system creates an unauthorized user in the calling system with the dangerous SAP_ALL profile. Attackers can also use this exploit to change salary information, modify programs, and many other scenarios.

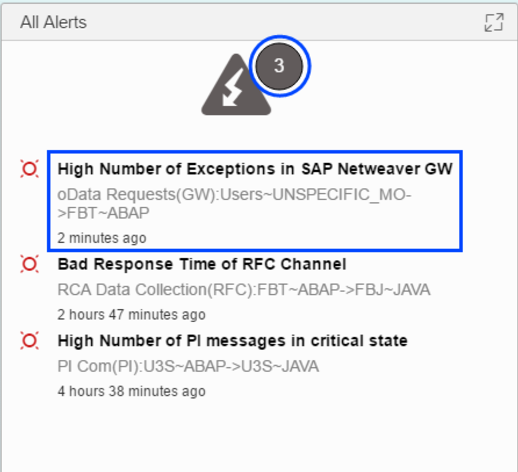
Systems vulnerable to RFC exploits can be discovered using SAP Solution Manager. Solution Manager regularly scans and alerts for vulnerabilities in RFC communications such as weaknesses in access control lists for RFC gateways, RFC users with administrative profiles, RFC destinations with stored logon credentials, and missing whitelists for RFC callbacks. The Monitoring and Alerting Infrastructure (MAI) of Solution Manager generates alerts for changes to RFC destinations, successful or unsuccessful attempts to call external programs through the gateway server, and RFC callbacks. Contact Layer Seven Security to discuss how to leverage Solution Manager to discover and remove RFC vulnerabilities in your SAP systems.

SAP RFC Hacking from Layer Seven Security on Vimeo.

Introducing the New Dashboard Framework for SAP Solution Manager

Earlier this year, SAP announced the general availability of Focused Insights, an enhanced dashboard framework for SAP Solution Manager. The framework was previously only available to MaxAttention customers as part of MaxAttention Next Generation Add-On (MANGO) services but is now available for all SAP customers. The dashboards aggregate real-time and historical data collected by Solution Manager to analyze performance against over 800 best-practice KPIs. They are grouped into operational, tactical and strategic clusters.

Operational dashboards are used for business process monitoring and include jumps to alerts for issues related to service levels. See below.

SAP Solution Manager Focused Insights Operational Dashboards

Tactical dashboards monitor a range of system-related KPIs based on predefined performance thresholds for each metric. Views can be arranged by category or system.

SAP Solution Manager Focused Insights Tactical Dashboards

You can drill down from the aggregated level to view the details for each metric. In the example below, we can monitor the patch levels and support schedules for products, components, databases, operating systems and kernels by navigating from the Maintenance section in the display for each system. Click on the image to enlarge.

SAP Solution Manager Focused Insights Tactical Dashboard Detail

Strategic dashboards are targeted at senior managers and executives to monitor service levels against expected standards. The dashboards aggregate data over extended periods to measure performance over time. In the Scorecard below, measures for areas such as service quality, business continuity, efficiency and capacity can be customized to align with specific targets.

SAP Solution Manager Focused Insights Strategic Dashboards

For Security, tactical dashboards identify missing Hot News and High priority Notes for each system. They also monitor users with access to critical authorizations and transactions, as well as non-compliant security parameters, insecure RFC destinations, and clients open to direct changes.

SAP Solution Manager Focused Insights Security Dashboards

The dashboards require the add-on ST-OST and can be enabled and configured in Solution Manager 7.1 SPS 13 or higher and the newly released Solution Manager 7.2. They do not require any coding or customization. Although the framework provides a rich set of packaged dashboards, customers can adapt SAP-delivered templates to meet specific requirements. Dashboards are rendered using HTML5 and therefore can be displayed on any platform or device, including mobile.

For more information, contact Layer Seven Security.

Securing Your Business: Security at SAP

In an open letter addressed to SAP customers earlier this year, SAP CEO Bill McDermott acknowledges the “tremendous concern around information security” given the “relentless and multiplying” threat presented by increasingly sophisticated attackers. The letter introduces the SAP paper Securing Your Business that discusses security trends and outlines SAP’s response to cyber threats.

According to the paper, cyber threats are driven by the growth in the volume of enterprise data, the growing value of data, the increasing connectivity and vulnerability of endpoints, and the commercialization of attacks.

The paper also discusses weaknesses in traditional security technologies such as firewalls and intrusion detection systems that are routinely bypassed by advanced and often encrypted exploits. The paper recognizes that attackers target enterprises systems such as SAP given the extensive and valuable data stored and processed by such systems.

The paper concludes by presenting SAP’s portfolio of products for preventing, detecting and responding to security breaches.  This includes Enterprise Threat Detection (ETD), Governance, Risk and Compliance (GRC) and Code Vulnerability Analysis.  The paper also cites services and tools available in SAP Solution Manager including SOS and System Recommendations.

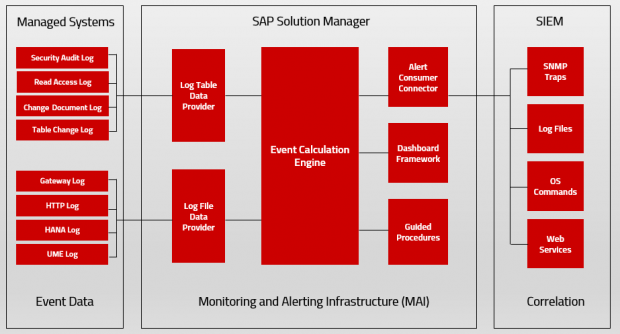
Other important areas for security in SAP Solution Manager include Configuration Validation (ConVal). ConVal performs daily, automated scans for hundreds of vulnerabilities in SAP systems and is therefore an important preventative tool for responding to cyber threats. Furthermore, areas such as the monitoring and alerting infrastructure of SAP Solution Manager monitor SAP logs for signs of malicious attacks and generate alerts to warn responders of potential security breaches. Finally, tools such as Usage Procedure Logging, Solution Documentation and Business Process Change Analyzer (BPCA) identify application and functional areas impacted by Security Notes to increase the speed of response for SAP patches.

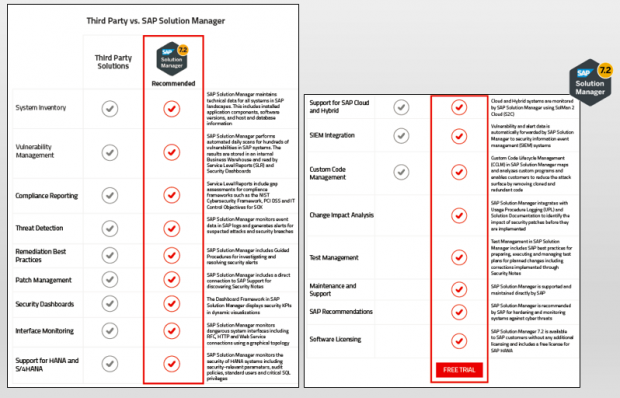
In contrast to many of the products outlined in the paper, SAP Solution Manager is installed in most SAP landscapes and therefore does not require any additional licensing. Contact Layer Seven Security to discuss how to implement advanced security monitoring and respond to cyber threats by optimizing your SAP Solution Manager.

Cybercrime Projected to Reach $2 Trillion by 2019

According to a recent study from Juniper Research, the worldwide cost of data breaches will exceed $2 trillion by 2019. This is equivalent to 2.2% of forecast global GDP and represents a four-fold increase upon data breach costs in 2015. The average cost of data breaches will also increase to $150 million or 25 times the current average of $6 million.

data-breach-costs-2015-2020

Data breaches are expected to not only intensify in terms of their impact, but also grow more prolific. Globally, there were 6,000 breaches in 2015. This is expected to reach 16,000 by 2020. The increase will be due in part to the growing attack surface caused by the growth in enterprise data. According to IDC, total worldwide enterprise storage capacity will be 521,000 petabytes in 2020.

projected-volume-of-data-breaches-2015-2020

Presently, approximately 60 percent of data breaches occur in the United States. The proportion is expected to fall to 50 percent by 2020 with the growing digitization of the rest of the world.

Despite the growth in mobile communications and IoT (Internet of Things), the majority of breaches are expected to arise from the exploitation of vulnerabilities in existing IT and network infrastructure rather new and emerging technologies.

The full report is available at Juniper Research. The report provides an in-depth analysis of the current and future threat landscape including sector-by-sector trends and forecasts.