Discover Vulnerable System Connections with Interface Monitoring
Interface Monitoring provides the answer to one of the most vexing questions in SAP security: where are our vulnerable cross-system connections and how do we monitor them to ensure they’re not abused by attackers?
Although Interface Monitoring, also known as Interface Channel Monitoring or ICMon, has been available in SAP Solution Manager since version 7.10 SP05, the application has been completely overhauled in version 7.2, especially in SP05, which has been in general availability since June.
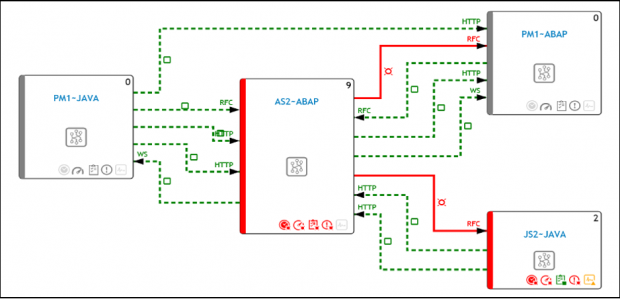
ICMon in SolMan 7.2 includes an SAPUI5 graphical display that automatically maps the entire landscape topology in a single screen (see below). Topologies are generated by ICMon based on so-called monitoring scenarios configured in Integration Monitoring within SolMan configuration.
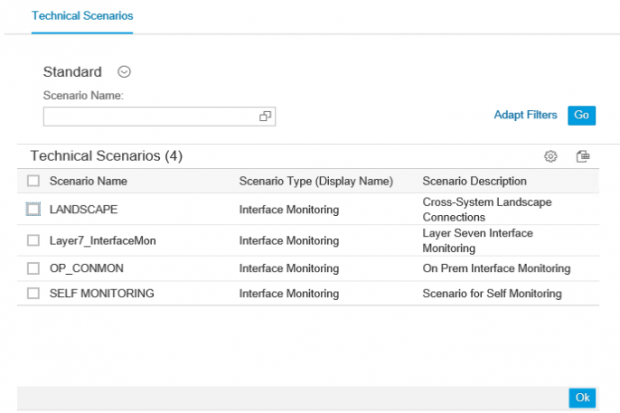
During scenario creation, you specify the systems and channels to monitor in each scenario. Multiple scenarios can be created to monitor different channels, systems, environments or other variables. Scenarios can also be landscape-wide to include all available systems and even cross-landscape to monitor systems located in different SAP landscapes.
Unlike some third party security tools that focus exclusively on RFC communications, ICMon can support monitoring for any SAP-supported protocol. This includes not only RFC, but HTTP, HTTPS, IDoc and Web Services.
Once the scenarios are configured, you can select from the list of available scenarios from Scope Selection in ICMon to monitor the scenario.
ICMon’s ability to automatically generate a graphical topology of cross-system connections enables users to discover vulnerable interfaces between systems including trust RFC relationships between systems in different environments. Trust relationships and stored credentials in RFC destinations could be exploited by attackers to, for example, pivot from vulnerable development or test systems to productive systems.
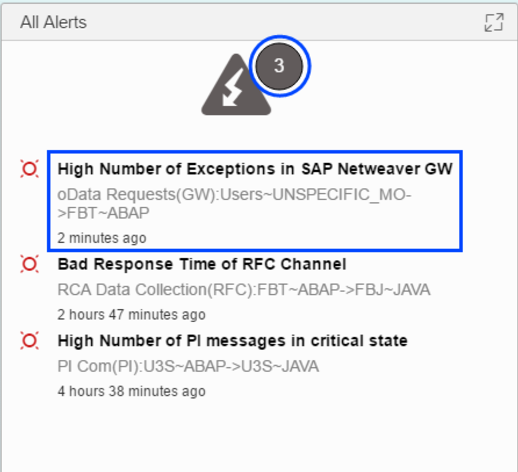
However, ICMon doesn’t just generate a static topology of system interfaces. It also continuously collects metrics and usage data for each channel to monitor availability, configuration and performance errors. Errors and warnings are displayed in both the ICMon dashboard (see below) and the topology. Connections with errors or warnings are displayed in red in the topology. Successful connections are displayed in green.
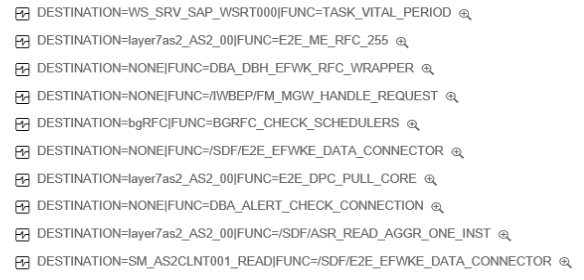
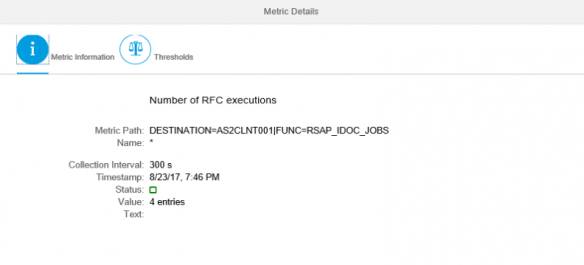
Usage data includes destinations and function modules called through each RFC channel with timestamps.
Alerts configured for metrics and thresholds including security-related scenarios can be viewed in the Alert Ticker from the ICMon home screen. The alerts can also be viewed in the Alert Inbox of SAP Solution Manager. In common with alerts for other application areas, ICMon uses the Monitoring and Alerting Infrastructure (MAI). Therefore, the Guided Procedure Framework can be used to apply standard operating procedures and best practices for incident management and alert handing.


